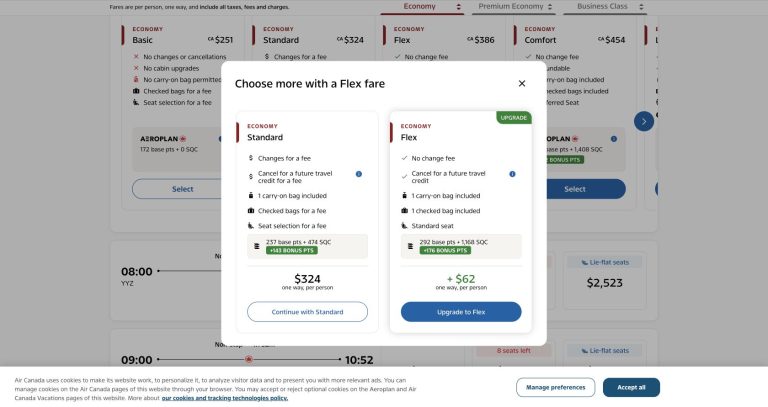
Flight booking
Air Canada vs WestJet
How each website explained the fare, added choices and moved the customer towards payment.
Website journey audits, ranked by your own GA4 data
UX Robot completes one real customer task on your website, such as booking a room or requesting a quote, in a real browser. It ranks everything it finds by your Google Analytics 4 data, shows each fix on your actual page, and checks after launch whether the change worked.
Connect GA4 once. Google Search Console and Microsoft Clarity add more evidence when you have them.
Measured, not guessed
Every finding is ranked by the visits and outcomes it affects in your own data.
Shown, not described
The top fixes are pictured on your real page before anyone writes code.
Proved, not assumed
The same journey runs again after launch and reports what improved.
01 / Why UX Robot
A checklist review tells you what might be wrong with a page. UX Robot does the task your customer came to do, measures how much each problem costs, and shows you the change on your own website.
It does the task, not a page scan
UX Robot starts where your customer starts and works through every page, choice and form until the task is done or it reaches a safe stopping point. It never pays, submits personal details or changes anything on your website.
Every finding is measured or clearly marked
A finding backed by your GA4 data shows the visits and outcomes it affects and is labelled Measured. Anything seen only in the browser is labelled Observed only. Measured problems come first, so you fix what costs the most.
You see the fix on your own page
For the top priorities, UX Robot makes an after picture: your real page with the suggested wording or layout change applied in its own browser. Wording pictures are checked against the original so only the planned words changed, and layout changes are labelled as illustrations. Two versions can sit side by side, ready to test A against B.
It checks whether the fix worked
Check a new page before it ships against the live page it replaces. The approved report sets a launch baseline, and after launch the same journey runs again and reports whether the new page beat, matched or missed it.
An example journey
A small hotel attracts plenty of visitors to its family room page, but too few start a direct booking. UX Robot books the room the way a parent would, then tests what it saw against the hotel’s own data.
In the browser
On a phone, parking, room capacity and cancellation terms sit below the photos and the booking button. The page asks for dates before it answers the practical questions.
Google Analytics 4
Most visits to the room page leave before opening the booking calendar. The problem happens before checkout, not during payment, so this priority is labelled Measured.
Google Search Console
Searches for family rooms with parking lead to this page. The right visitors are arriving with a clear need, so demand is not the problem.
Microsoft Clarity
Visitors scroll past the booking button and back again, which is consistent with questions the page has not answered.
The combined insight
The sources agree. Search rules out a demand problem, GA4 places the exit before the calendar, and the browser shows why: the practical questions are answered too late. The likely problem is unanswered questions, not demand or checkout.
The decision
Move room capacity, parking and cancellation details beside the room summary, with a clear “Check family room availability” button straight after them. After launch, run the same journey on the live page and compare calendar opens and bookings with the launch baseline.
Choose a journey
Write it yourself, or pick one UX Robot suggests from your GA4 data.
Complete it for real
Every page, choice and form, on a locked device and screen size.
Rank by your data
GA4 measures how many visits and outcomes each problem affects.
See the fix
After pictures show the change on your own page.
Prove it worked
Run the journey again after launch against the baseline.
02 / Start with one customer task
Say who the visitor is, what they want to do and why it matters, what success looks like and where to stop safely. Not sure where to begin? UX Robot suggests journeys worth testing from your GA4 landing pages and key events.
Example journey
As a parent planning a weekend away, I want to find a family room with parking and check availability, so I can book directly with confidence.
Lock the conditions
Choose the device, market and screen size. Every run of the journey uses the same conditions, so one result can be compared with the next.
UX Robot completes the journey
It records what helps or blocks the task at each step, with a screenshot of the exact moment, and stops before anything that would charge money or contact a person.
Your data adds scale
Google Analytics 4 shows how many visits reach each page of the journey and finish. Google Search Console shows the searches that bring them. Microsoft Clarity shows clicks and scrolling when it is connected. Page speed and accessibility are measured on the pages the journey reached.
You get a ranked report
Each priority explains the problem, its measured impact, exactly what to change and how to tell whether the change worked, in words anyone in your team can follow.
From journey to decision
One customer task goes in. A ranked set of changes, pictures of the fixes and the measures that will prove them come back.
03 / What you receive
The report turns one journey into a short, ranked list of changes. Each one shows the evidence behind it, so you can act on it and defend it.
Measured or observed
Every priority says whether your data measured it or the browser observed it, and measured problems come first.
The evidence
Screenshots, figures and the pages affected, next to the finding they support.
What to change
A specific change, the place to make it and where to begin.
How to check the result
The measure that should move if the change works.
Example report
Measured
The right people reach the room page, but most leave before they can see whether it suits their family.
GA4 and Search Console show who arrives and where they leave. The browser screenshots show the questions the page answers too late.
Affects
Most room page visits
Based on
Browser, GA4 and search
After picture
Variants A and B
Top priorities
A short list of the changes most likely to help, ranked by measured impact.
After pictures
The suggested change shown on your real page, with a second version to test against it.
Stakeholder summary
A short summary for decision makers, with a PDF and a private share link.
What we could not check
A clear record of missing data or parts of the task we could not reach.
04 / Before and after launch
Run the journey on a test copy of a new page and compare it with the live page it will replace. The approved report sets the figures the new page has to beat. After launch, the same journey runs on the live page with fresh GA4 figures, and every measure gets a clear verdict.
Find the problems on a test copy while they are still cheap to fix.
The figures from the live page today, frozen when the report is approved.
The same journey, device and screen size, run on the new live page.
Each measure is reported as beat, matched, missed or not comparable.
Run the journey again whenever the page changes, and see what to work on next.
05 / A report anyone can read
Every finding is written in plain language, with the screenshot, the figures and the page it affects right beside it. You do not need to know UX, analytics or code to see what is wrong, how much it matters and what to change.
Plain language
Each problem says what visitors run into and why it matters, without UX or analytics jargon.
Evidence beside every claim
Screenshots and figures sit next to the finding they support, so anyone can check it for themselves.
Honest about its limits
Every priority is marked Measured or Observed only, and the report lists what it could not check.
Ready to share
A short stakeholder summary, a PDF and a private share link for the people who decide.
06 / Public comparisons
We publish comparisons of the same task on two public websites, tested under the same conditions. They show the method on websites we have no data for. A journey on your own website goes further: every finding is ranked by your GA4 evidence, and the top fixes are pictured on your page.
Flight booking
How each website explained the fare, added choices and moved the customer towards payment.
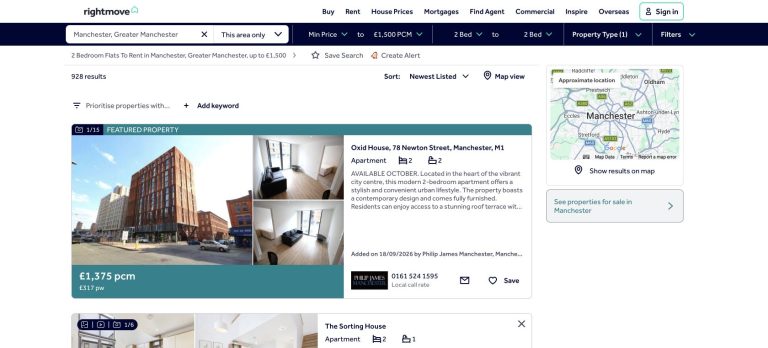
Property search
How account requirements made it easier or harder to contact an agent.
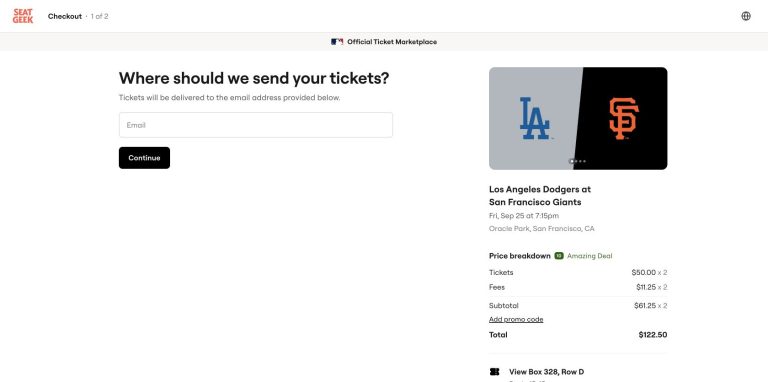
Ticket buying
How fees and sign in steps affected the path to buying two tickets.
The companies shown in public comparisons are not UX Robot customers and are not affiliated with us.